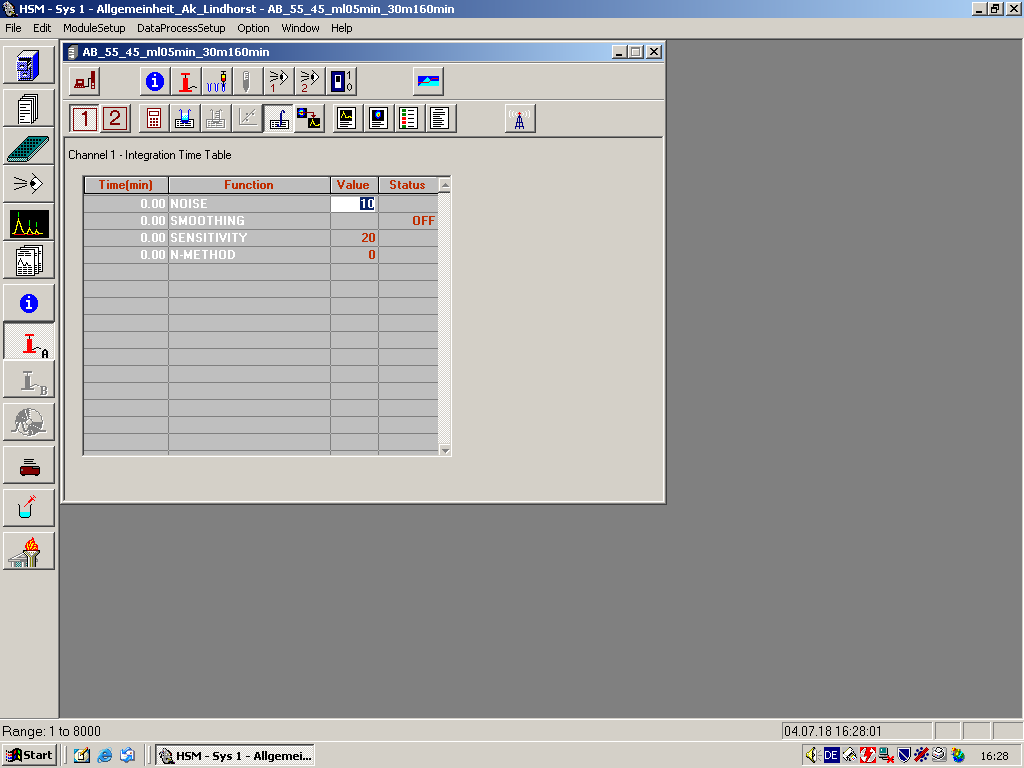
Integration Time Table
Use this command to review or set up the Integration Time Table. This table specifies how the baseline for chromatogram is determined and how the peaks are detected. The first four rows of the table are always set automatically with defaults that permit a basic baseline and integration calculation. They cannot be deleted. You can modify their values only.
Tool Bar Shortcut
| Table Entries | |
|---|---|
| Time (min) |
Specifies (in minutes) when an integration event will occur. |
| Function |
The peak integration function that you select determines how baselines will be constructed. See Integration and Baseline Correction for descriptions of all available functions. Note that Noise and Smoothing functions can only be specified at time 0.0 (as two of four defaults). They are not available in the drop down list Note: The access to the Value and Status cells depends on function selection. The HSM automatically frees the proper cell. For example, if the selected function is Sensitivity, the Value cell is freed for editing and the Status cell is made read-only. |
| Value |
For the Noise, Sensitivity, and N-Method functions, enter a value in this field. |
| Status |
For Smoothing, select Off or a desired Savitzky&Golay filter from the drop-down list. For other functions, you can select either On or Off. |
