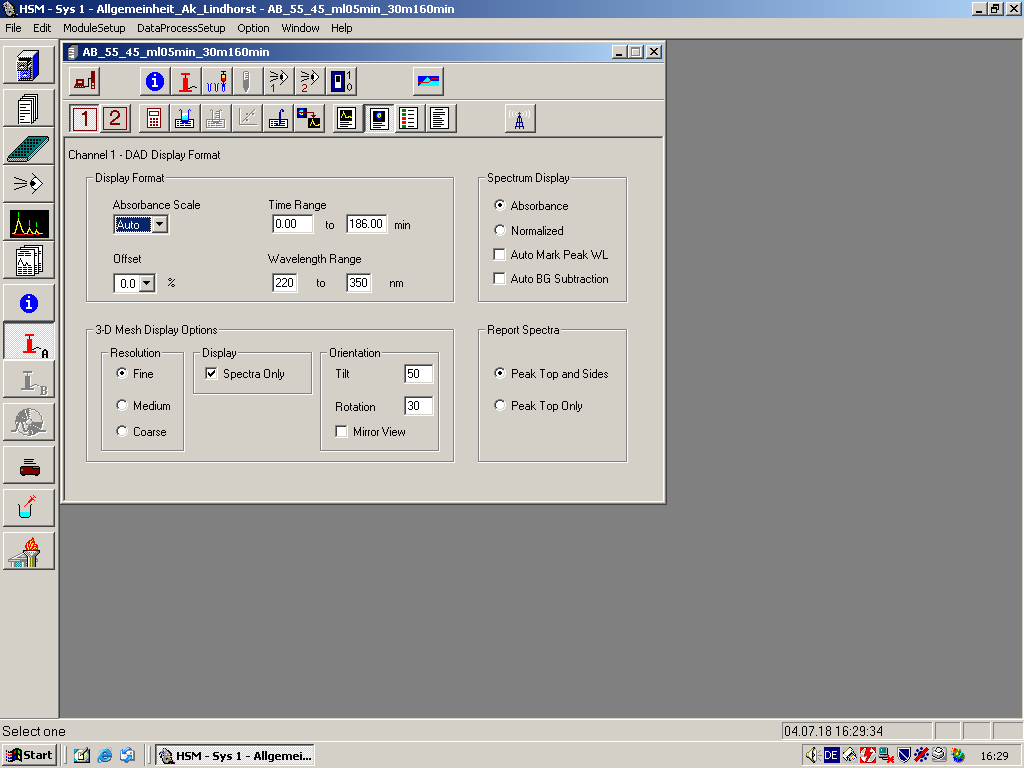
DAD Display Format
The DAD Display Format command is only available when a DAD detector is selected on the Method Configuration screen. Use this command to display and modify the DAD display format.
Tool Bar Shortcut
| Dialog Entries | |
|---|---|
| Display Format | Absorbance Scale: Specifies a value of absorbance scale from a fixed set to draw the Contour and 3-D displays and the associated chromatogram displays on the Data Display window. The default value is Auto. The range of selections with the L-4500 or L-7450 detectors is either from 2.0 to 0.005 or from 0.2 to 0.0005 depending on the Absorbance Mode selected in DAD Setup (Normal or Low). The range of selection with the L-7455 detector is from 2.0 to 0.0005.
Offset: The value specified is used to set the zero position on the AU scale for drawing Contour and 3-D displays. The default value is 0.0%.Time Range: Specifies the time range used to draw the Contour and 3-D displays.Wavelength Range: Specifies the wavelength range used to draw the Contour and 3-D displays. |
| Spectrum Display | Absorbance: Select to plot the spectrum using Absorbance Scale specified in Display Format.
Normalized: Select to plot the spectrum using the normalized scale where the maximum intensity of each spectrum is scaled to 1.0. Auto Mark Peak WL: Select to display labels on peaks detected on the spectrum plot. Auto BG Subtraction: If you are including spectra in a report, select to include background subtracted spectra, automatically. |
| 3-D Mesh Display Options |
Resolution: Select one from Fine, Medium, or Coarse. Display: Check Spectra Only to display the 3-D as a series of spectra. Orientation: Set Title and Rotation angles. Defaults are 50 and 30, respectively. Check Mirror View to display the mirror image. |
| Report Spectra | Report Spectra is disabled when Chromatograms to Create is set to None on DAD Data Processing screen. Add to check mark to select Peak Top and Sides (3 spectra) or Peak Top Only (1 spectra). |
